
Reporting: Flag Evaluation Volume
A report is now available to help you see how much traffic each of your feature flags is actually serving, broken down by environment.

You shipped a flag six months ago. It rolled out to 100%, the old code path got cleaned up, and everyone moved on. Is it still doing anything? Is the flag you created last week actually reaching production, or is it sitting there because the SDK never got wired up? Evaluation counts answer both questions, and until now you had to go dig through your own logs to get them.
Zenmanage now includes a Flag Evaluation Volume report. It joins Last Evaluation Date and Missing Default Value as the third report focused on how your flags are actually being used in production, not just how they're configured. You can find it in the reports section for any project environment.
Flag Evaluation Volume Report
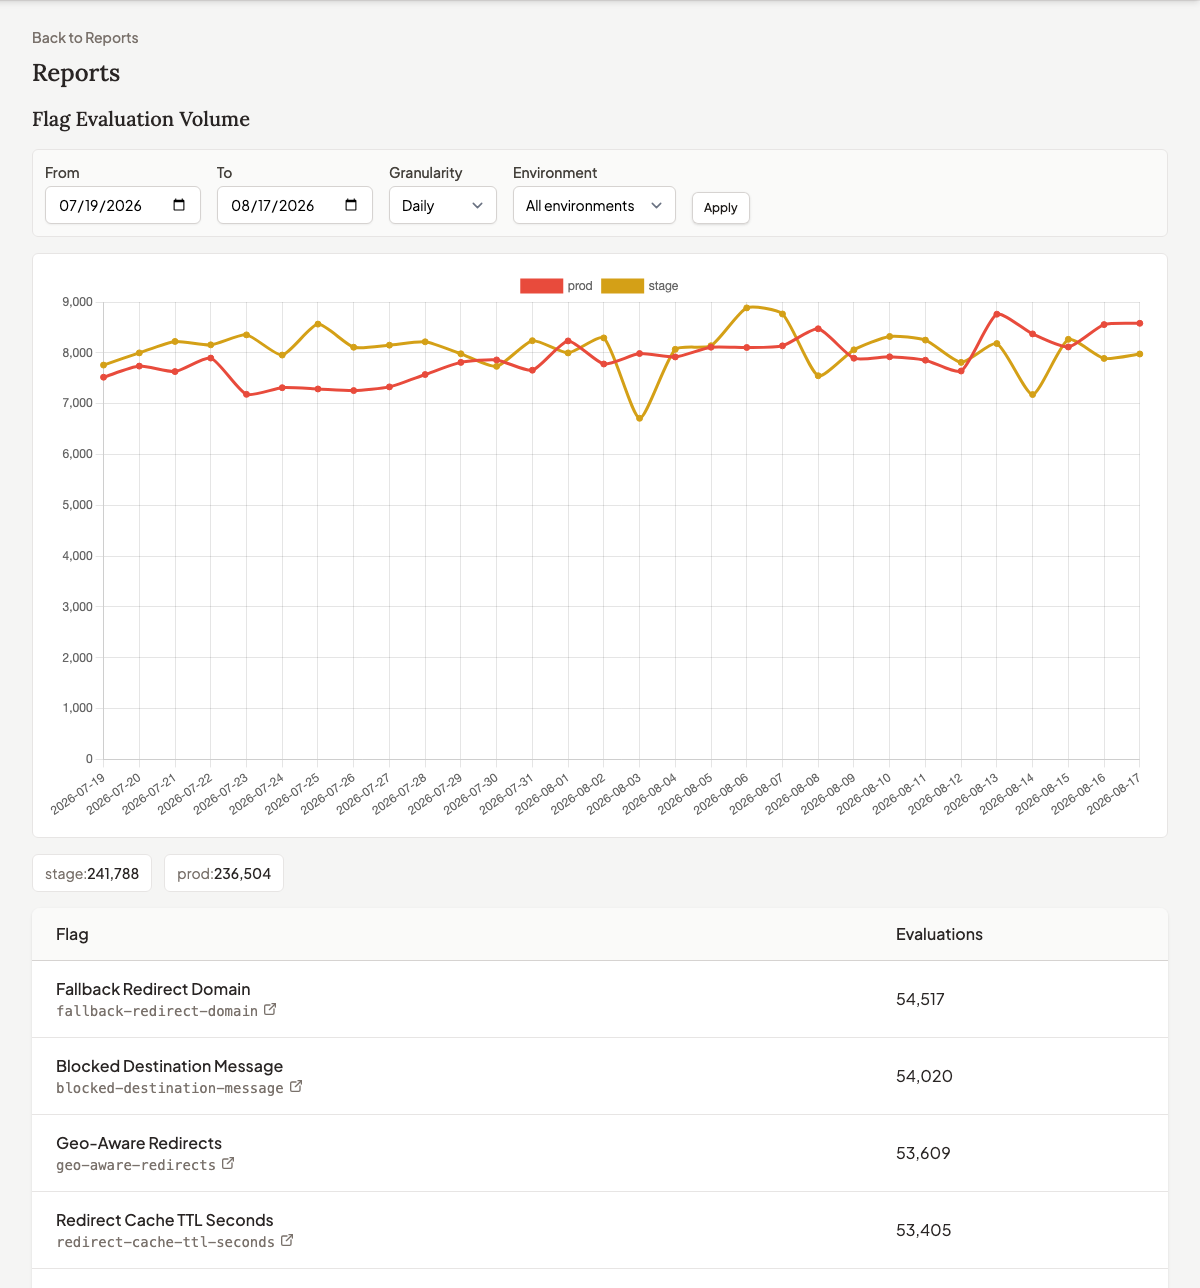
The chart plots daily, weekly, or monthly volume, split by environment so you can see production traffic separately from staging noise. Filter by date range and, if you want to zoom in on one environment instead of comparing them, narrow it down there too. Below the chart, environment totals give you the headline numbers, and a summary table ranks your flags so the busiest ones surface immediately.
Why evaluation volume matters in your software development lifecycle
Knowing how much traffic a flag is actually serving changes how you manage it:
Rollout Verification: When you flip a flag to 100% or launch a new feature behind it, volume tells you the rollout actually reached users, rather than trusting that a deploy went as planned.
Cleanup Prioritization: Paired with Last Evaluation Date, volume tells you not just whether a flag is still alive, but how much of your traffic depends on it, so you can prioritize cleanup around what's actually being served.
Environment Sanity Checks: A flag with heavy staging traffic and none in production is either not deployed yet or broken along the way. The per-environment breakdown catches that before a customer does.
Capacity Planning: If a flag gates an expensive code path, its evaluation trend tells you where load is headed before it becomes a problem.
Volume turns "is this flag still used" from a guess into a chart. That's what Flag Evaluation Volume is for.